![]()
Meteor met mast data management software
Harness your wind and solar resource assessment data with Meteor
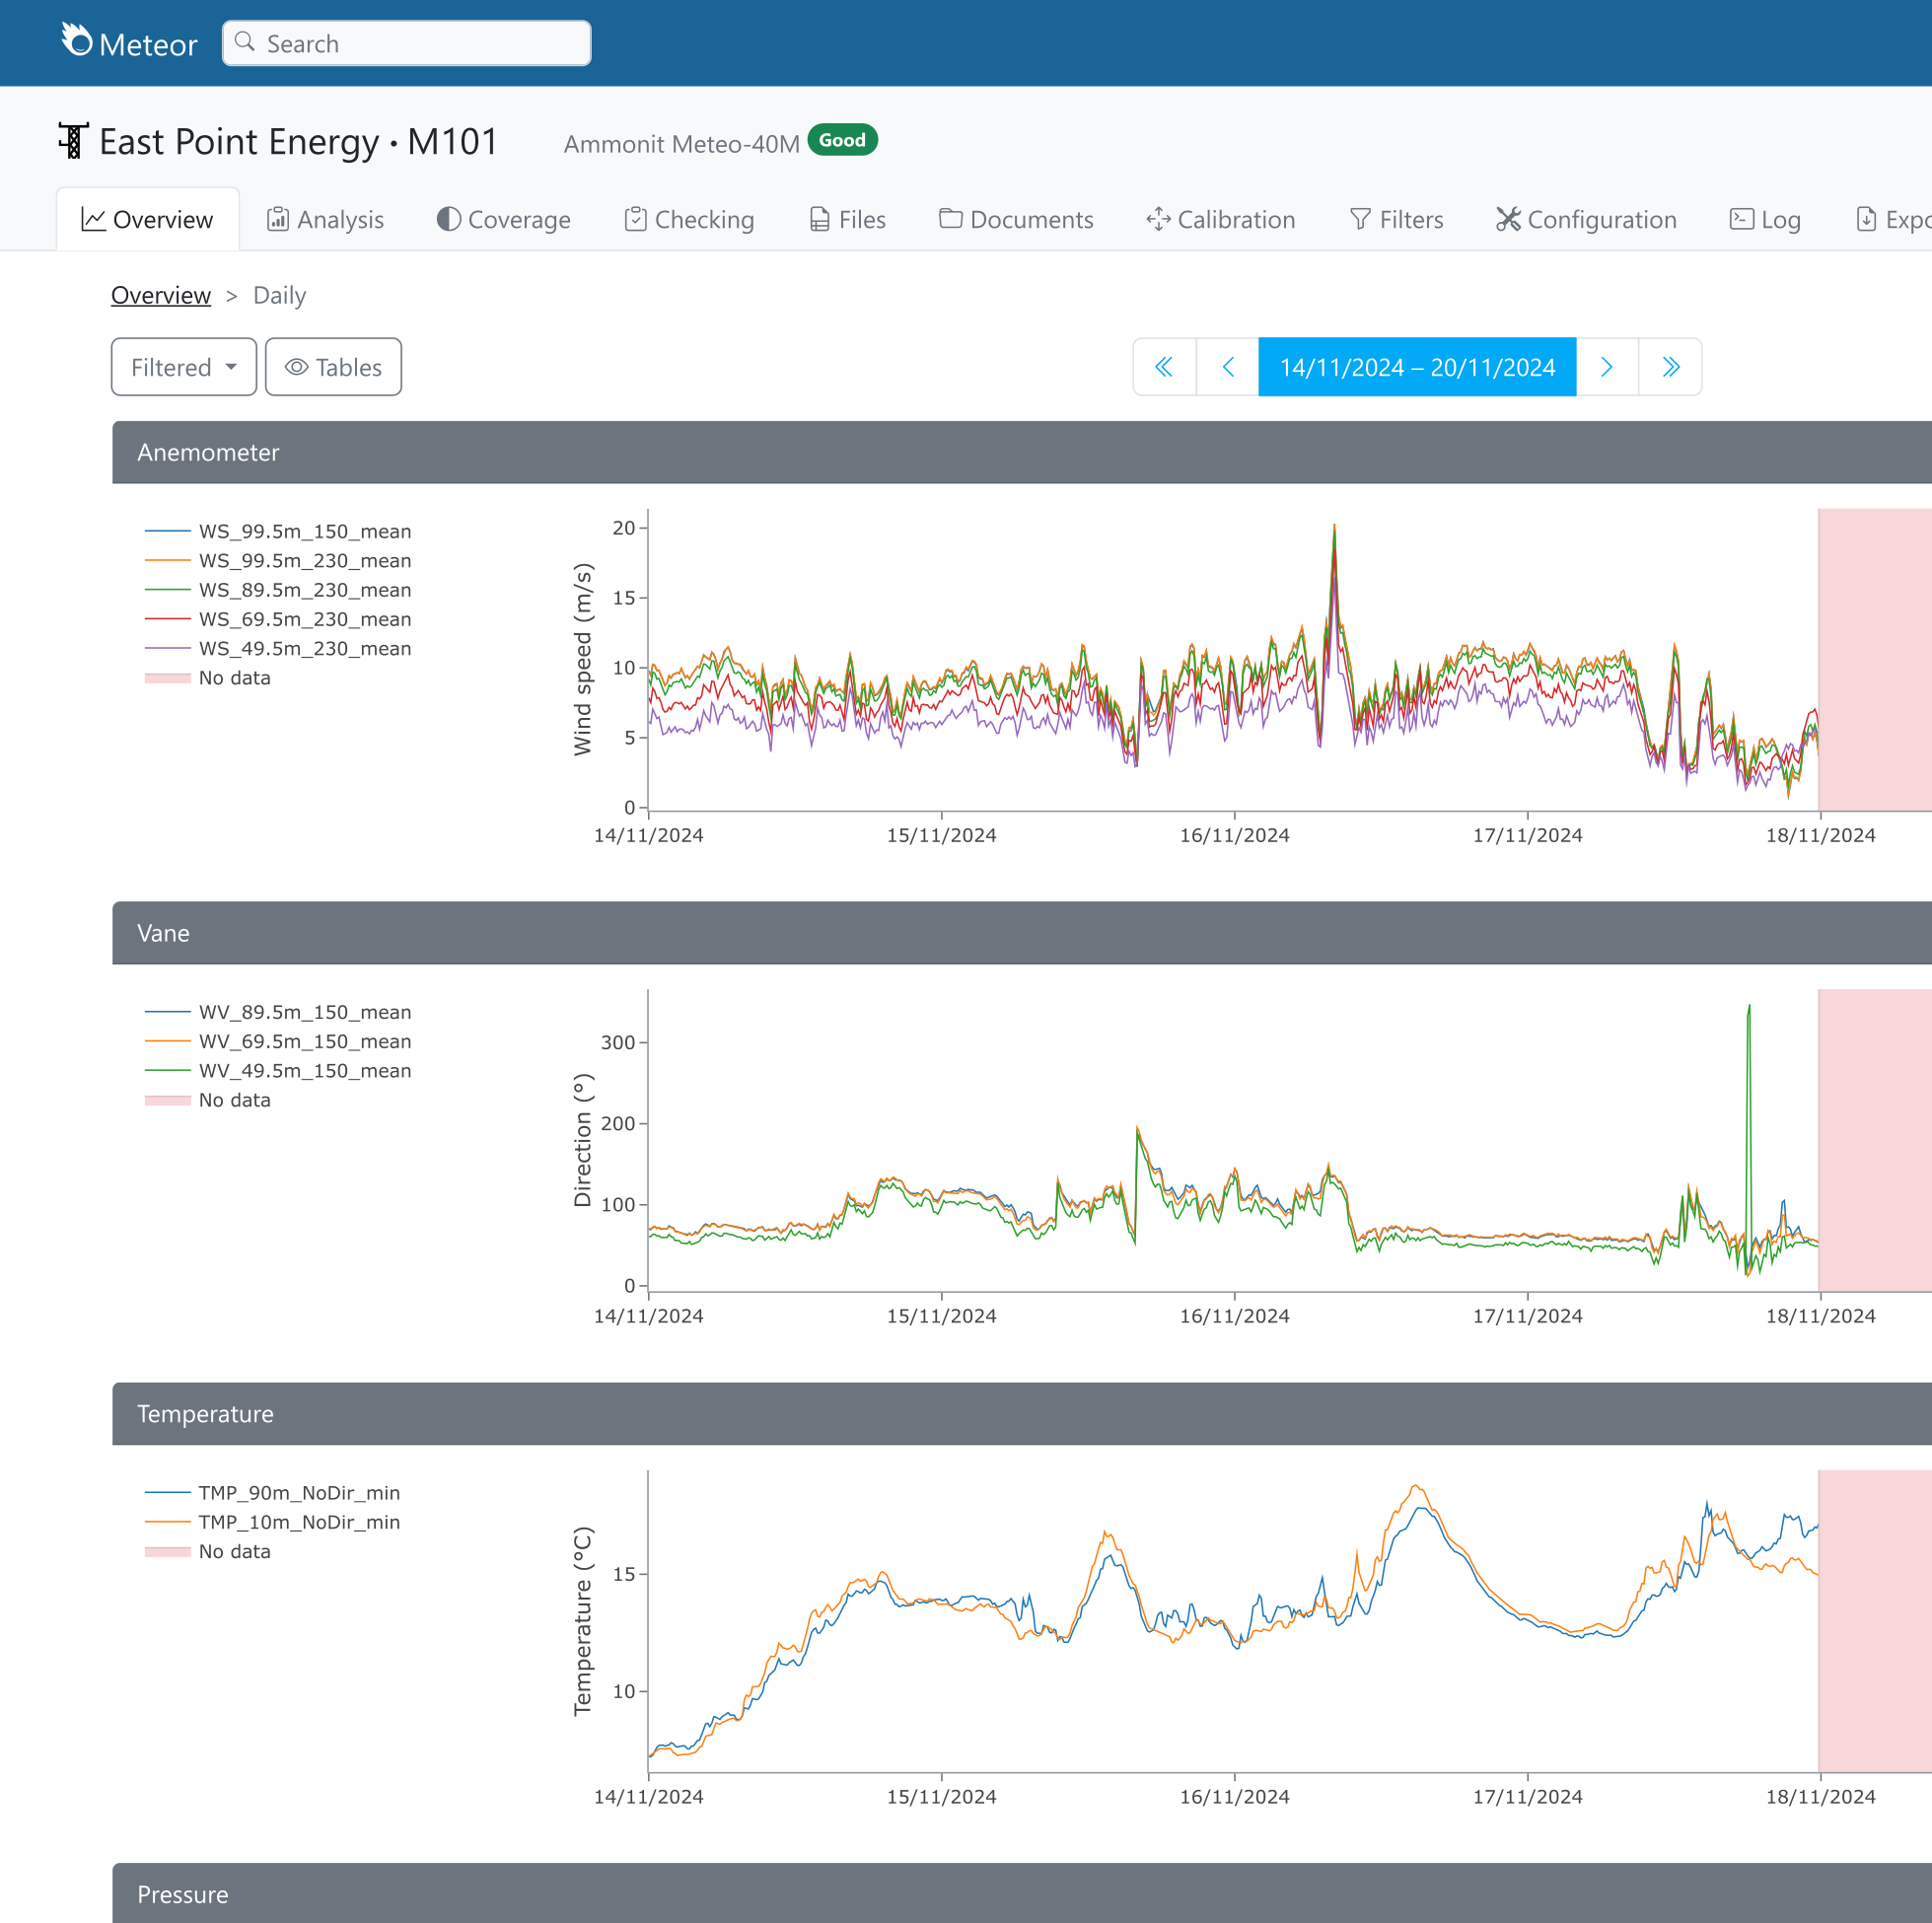
Visualise your data with ease
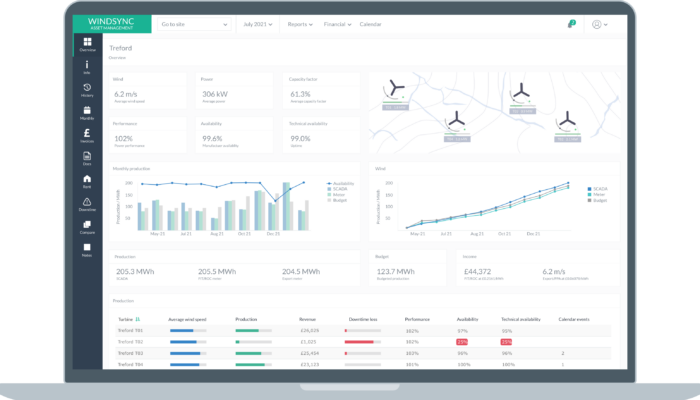
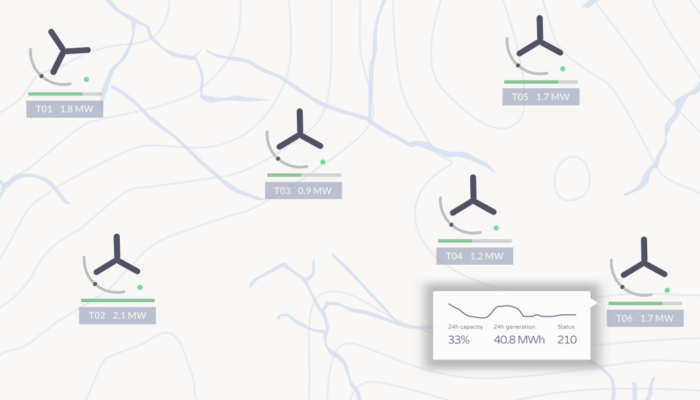
The intuitive web interface makes it easy to view data from every instrument from every mast and LIDAR.
The portfolio dashboard shows the status of all deployments and site pages allow for a deeper dive. Data coverage plots and heatmaps highlight any gaps or issues in the data.
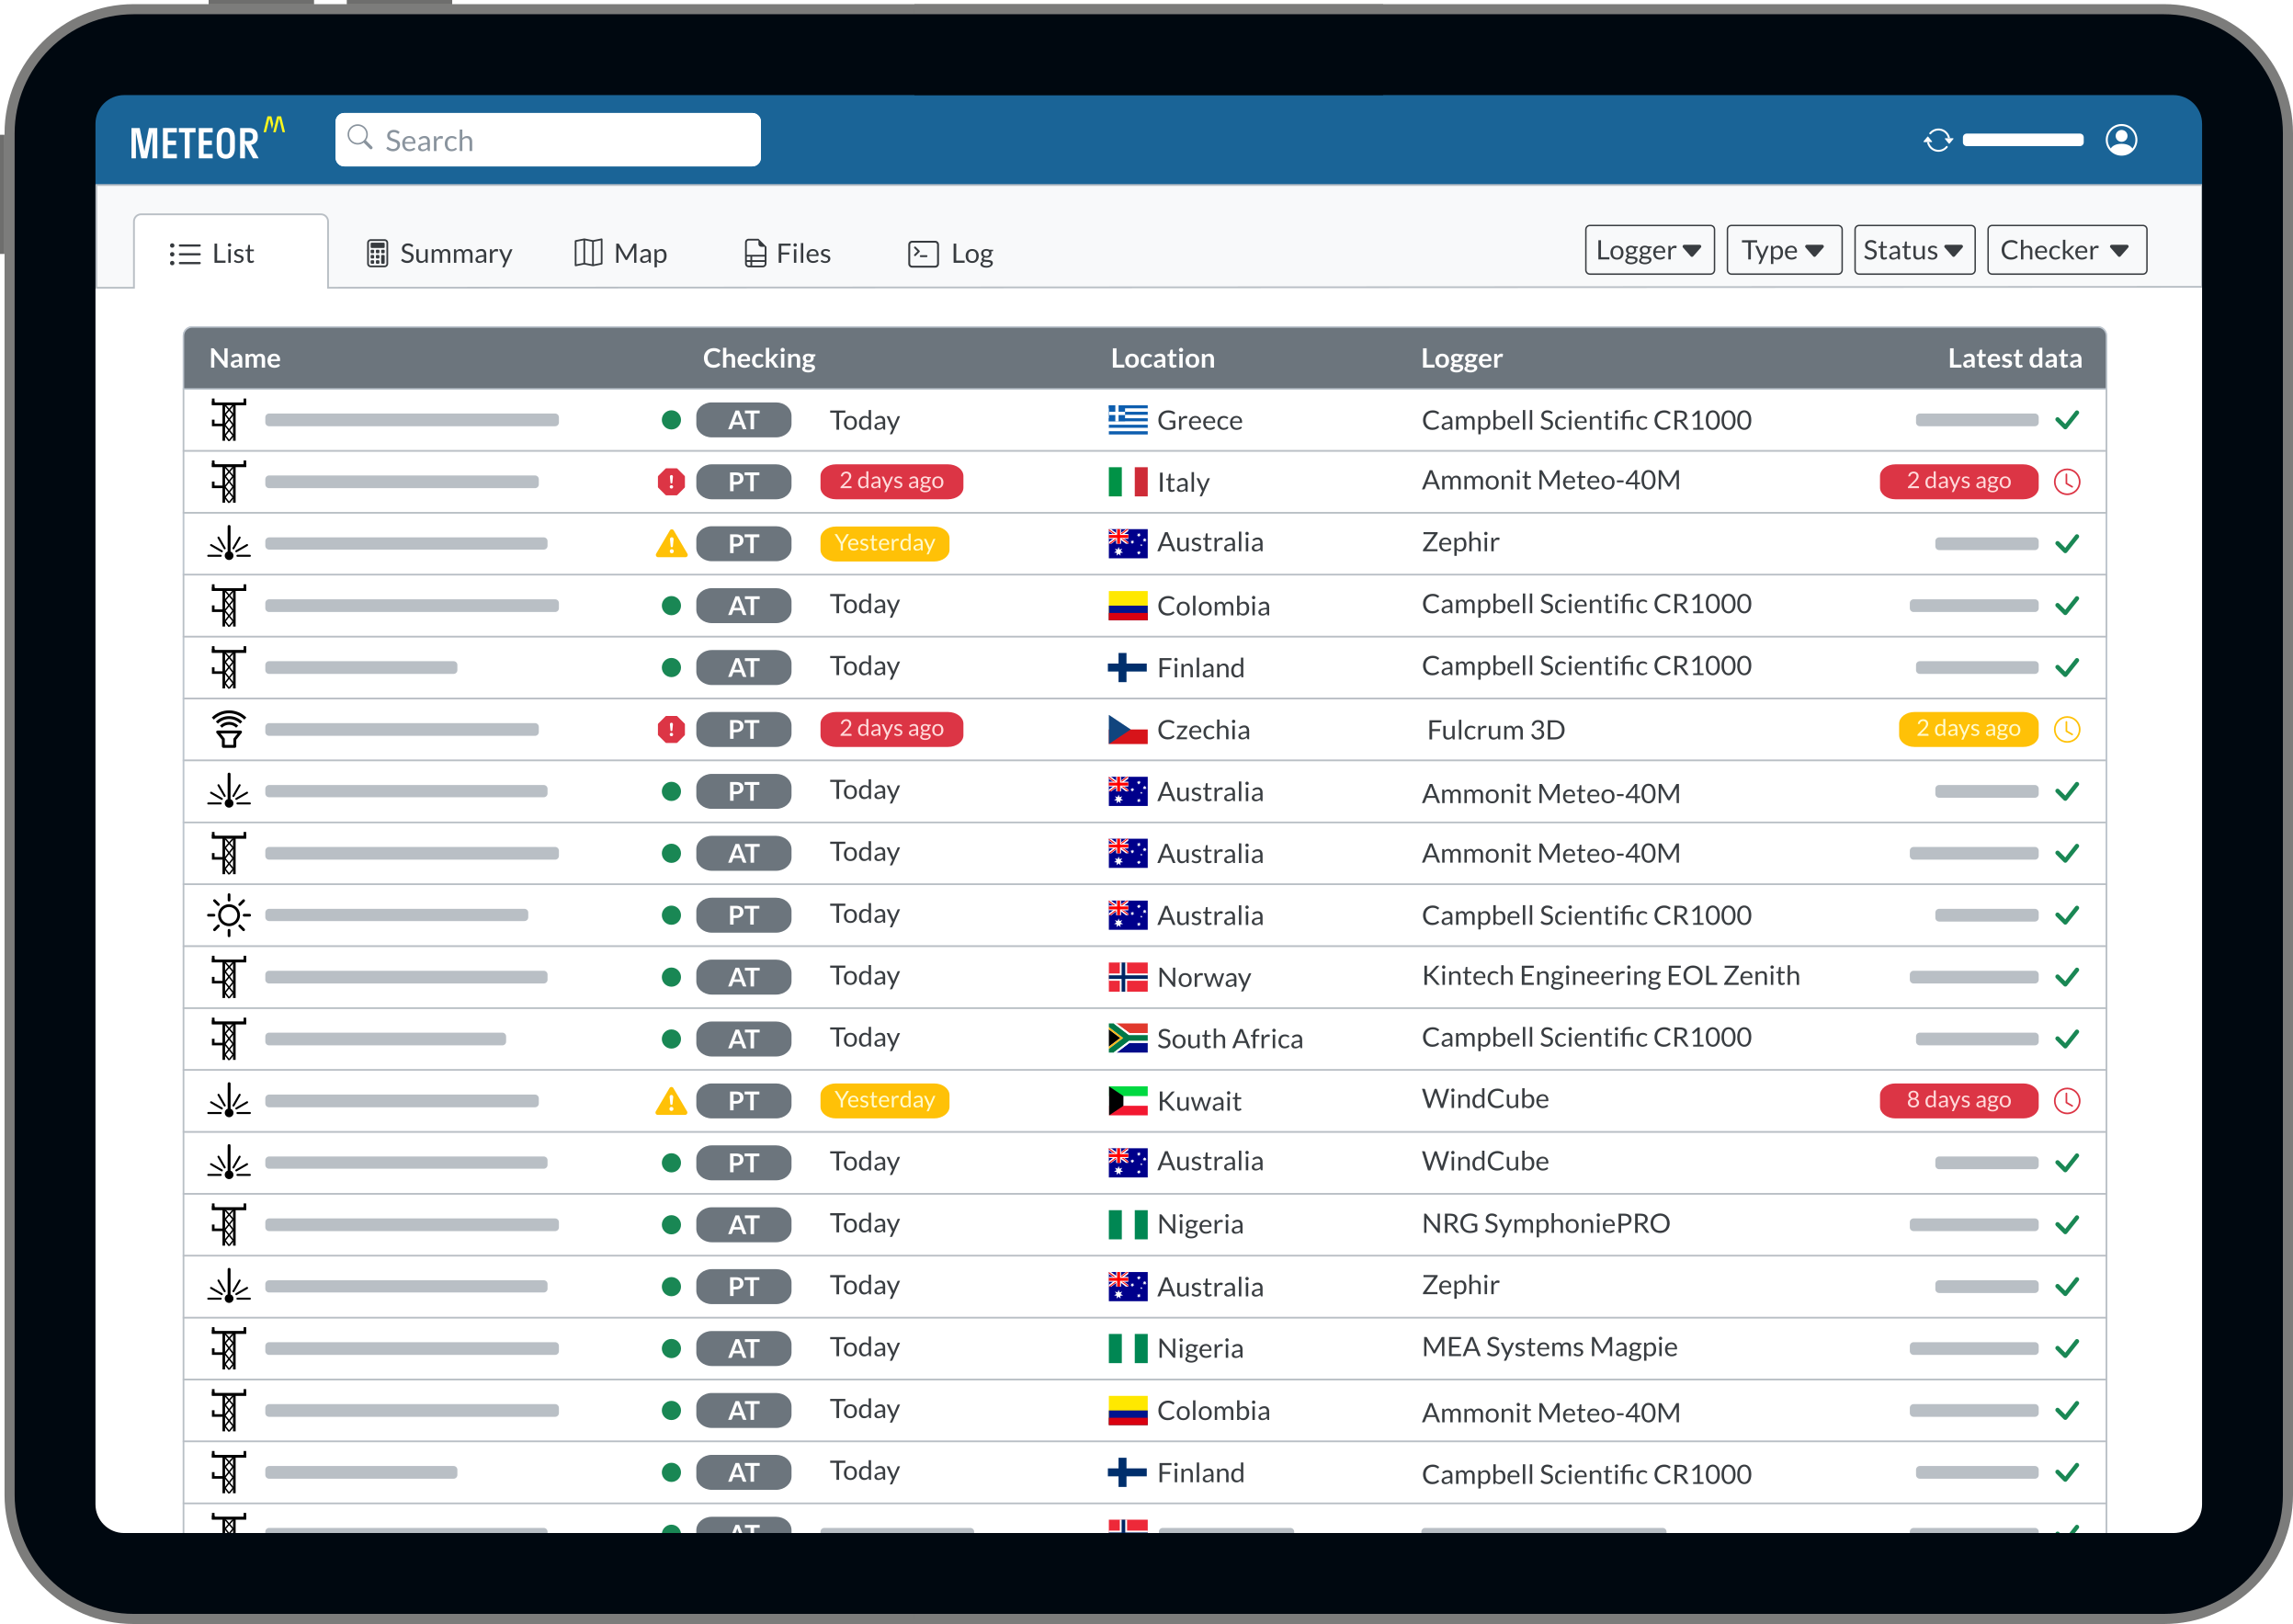
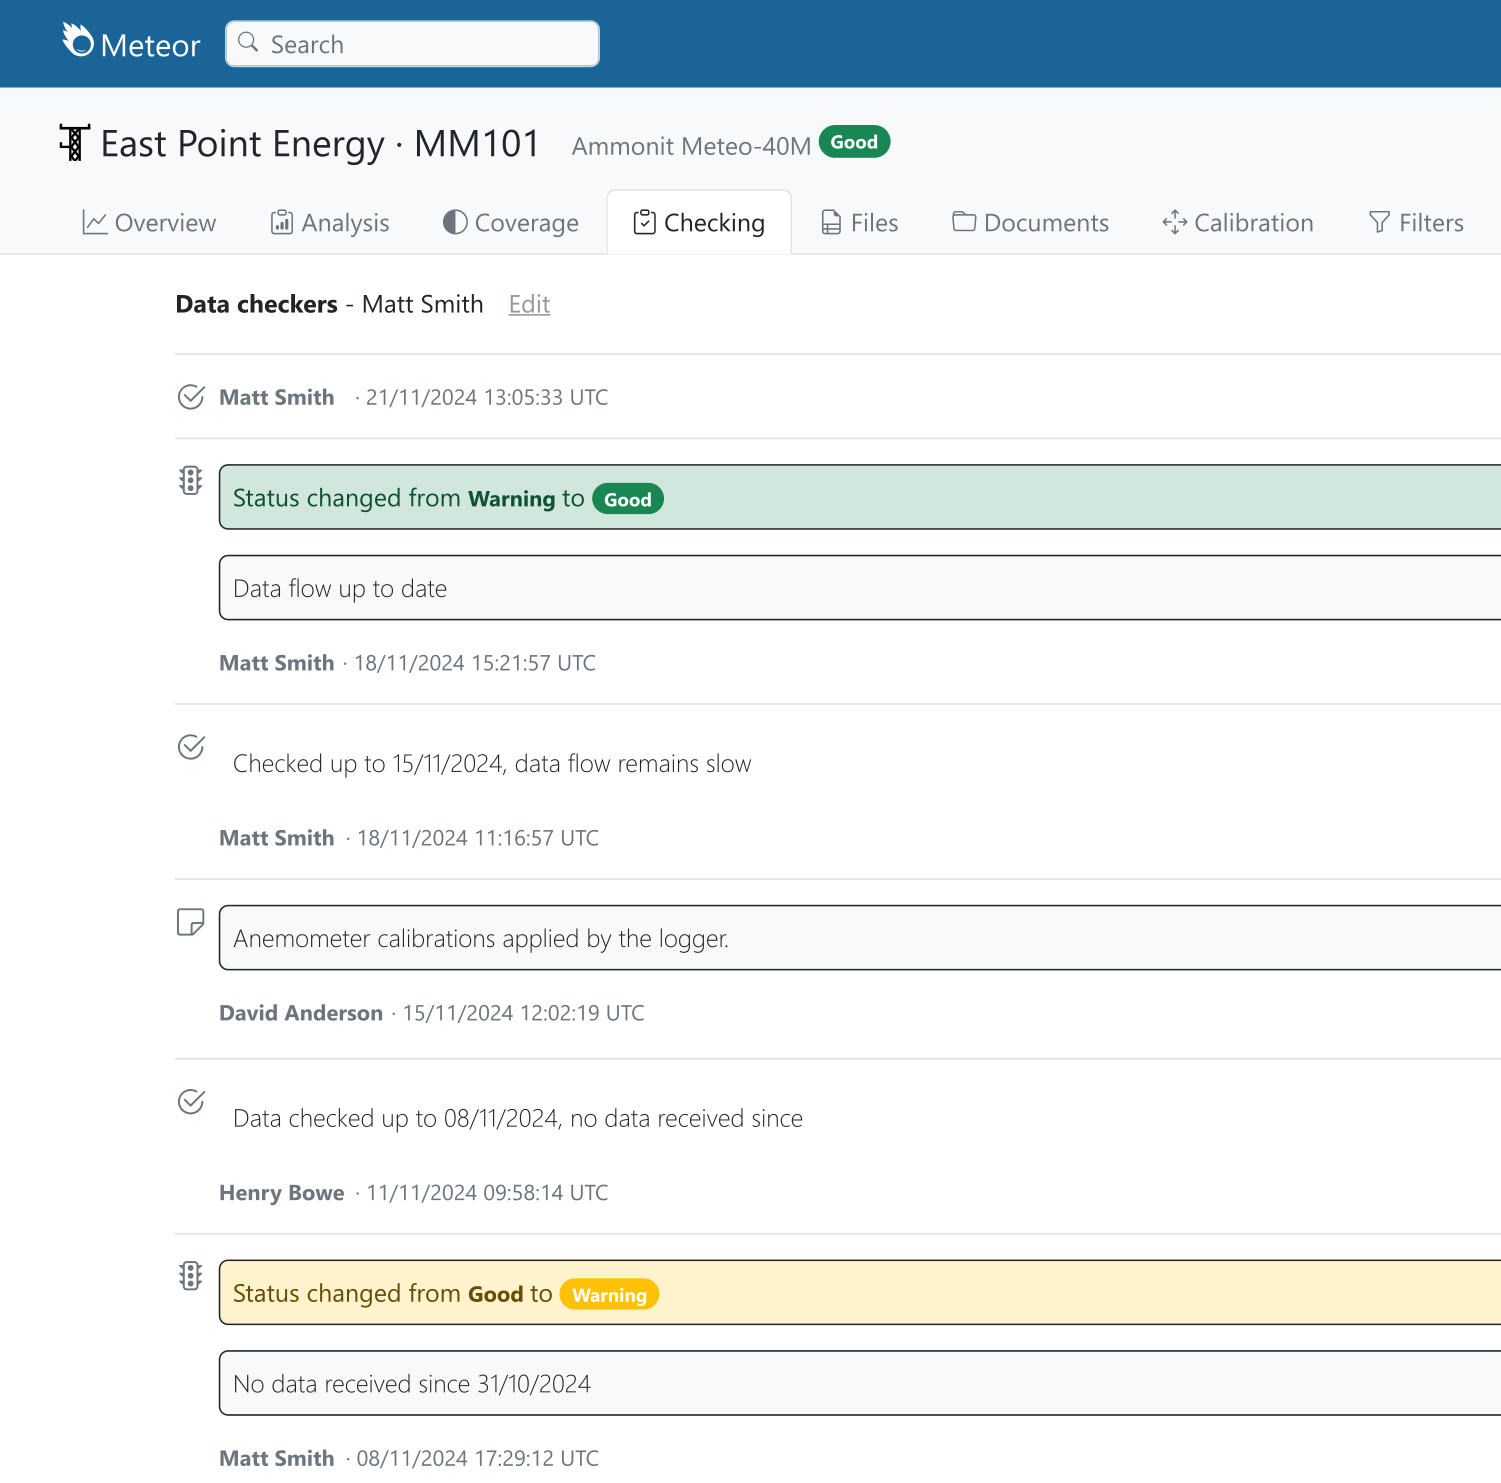
Never miss an issue
Met masts and LIDARs operate in all weather conditions month after month, year after year. Whether it’s a failing battery, a frozen anemometer cup or a loose cable, it is inevitable that issues will occur. Meteor ensures that any issues are picked up quickly through the use of email notifications and dashboard flags.
The data checking tools identify any missing or duplicate data and the analytics tools display met mast and LIDAR data in different ways to help you see unusual behaviour and gain insights about your sites.
Issues like missing data or icing are automatically detected so immediate action can be taken to resolve issues.
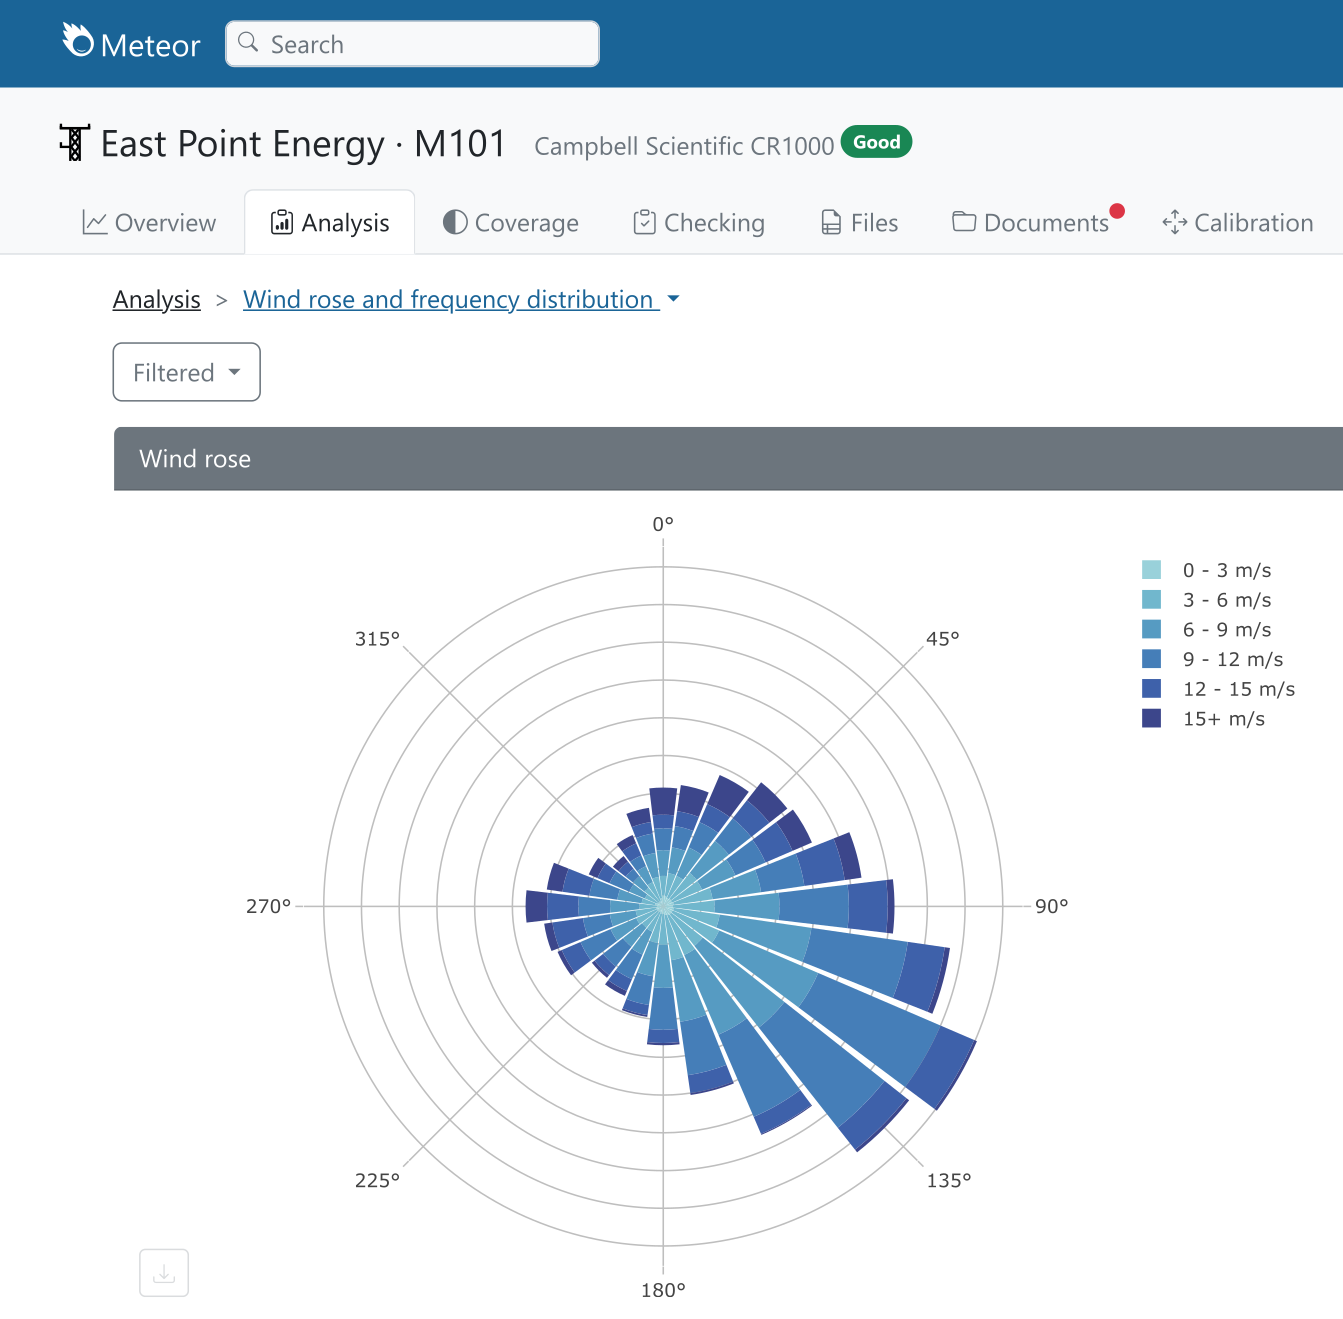
Industry standard analysis
A full range of analysis options gives maximum insight into what is happening at the mast or LIDAR site.
All the standard plots and tables are accessible including wind rose and frequency distribution, mean of monthly means, shear, turbulence intensity, correlation plots and wind speed ratio plots.
Calibrations and filtering
Handling the data from different met masts and remote monitoring sites can be a challenge. Each logger type has different data formats and ways of accessing the data. Any changes to the the instrumentation configuration mid-deployment can be difficult to handle.
Meteor’s walk through setup wizard makes setting up new masts a painless process and configuration changes are automatically detected and handled.
All the other key challenges like calibrations, timezones and filtering are also taken care of.

Put your data to work
The aim of every met mast and remote monitoring campaign is to assess the long term energy resource. Meteor calibrates met mast and LIDAR data with long term reanalysis data to give long term wind speed or irradiance estimates as well as providing wind rose and frequency distribution for wind sites.
Data can easily be exported from Meteor including filtered data, unfiltered data and source data files for use in other software.

Wind and solar resource monitoring
Meteor handles data from wind and solar resource monitoring campaigns.

Data aquisition and checking
Data is automatically imported from remote devices via several technologies including email and FTP. Data checking tools allow technicians to keep track of data completeness.

Calibrations and filtering
Instrument calibrations are handled seamlessly in Meteor. Automatic data filtering is applied to bad data due to issues such as anemometer icing.

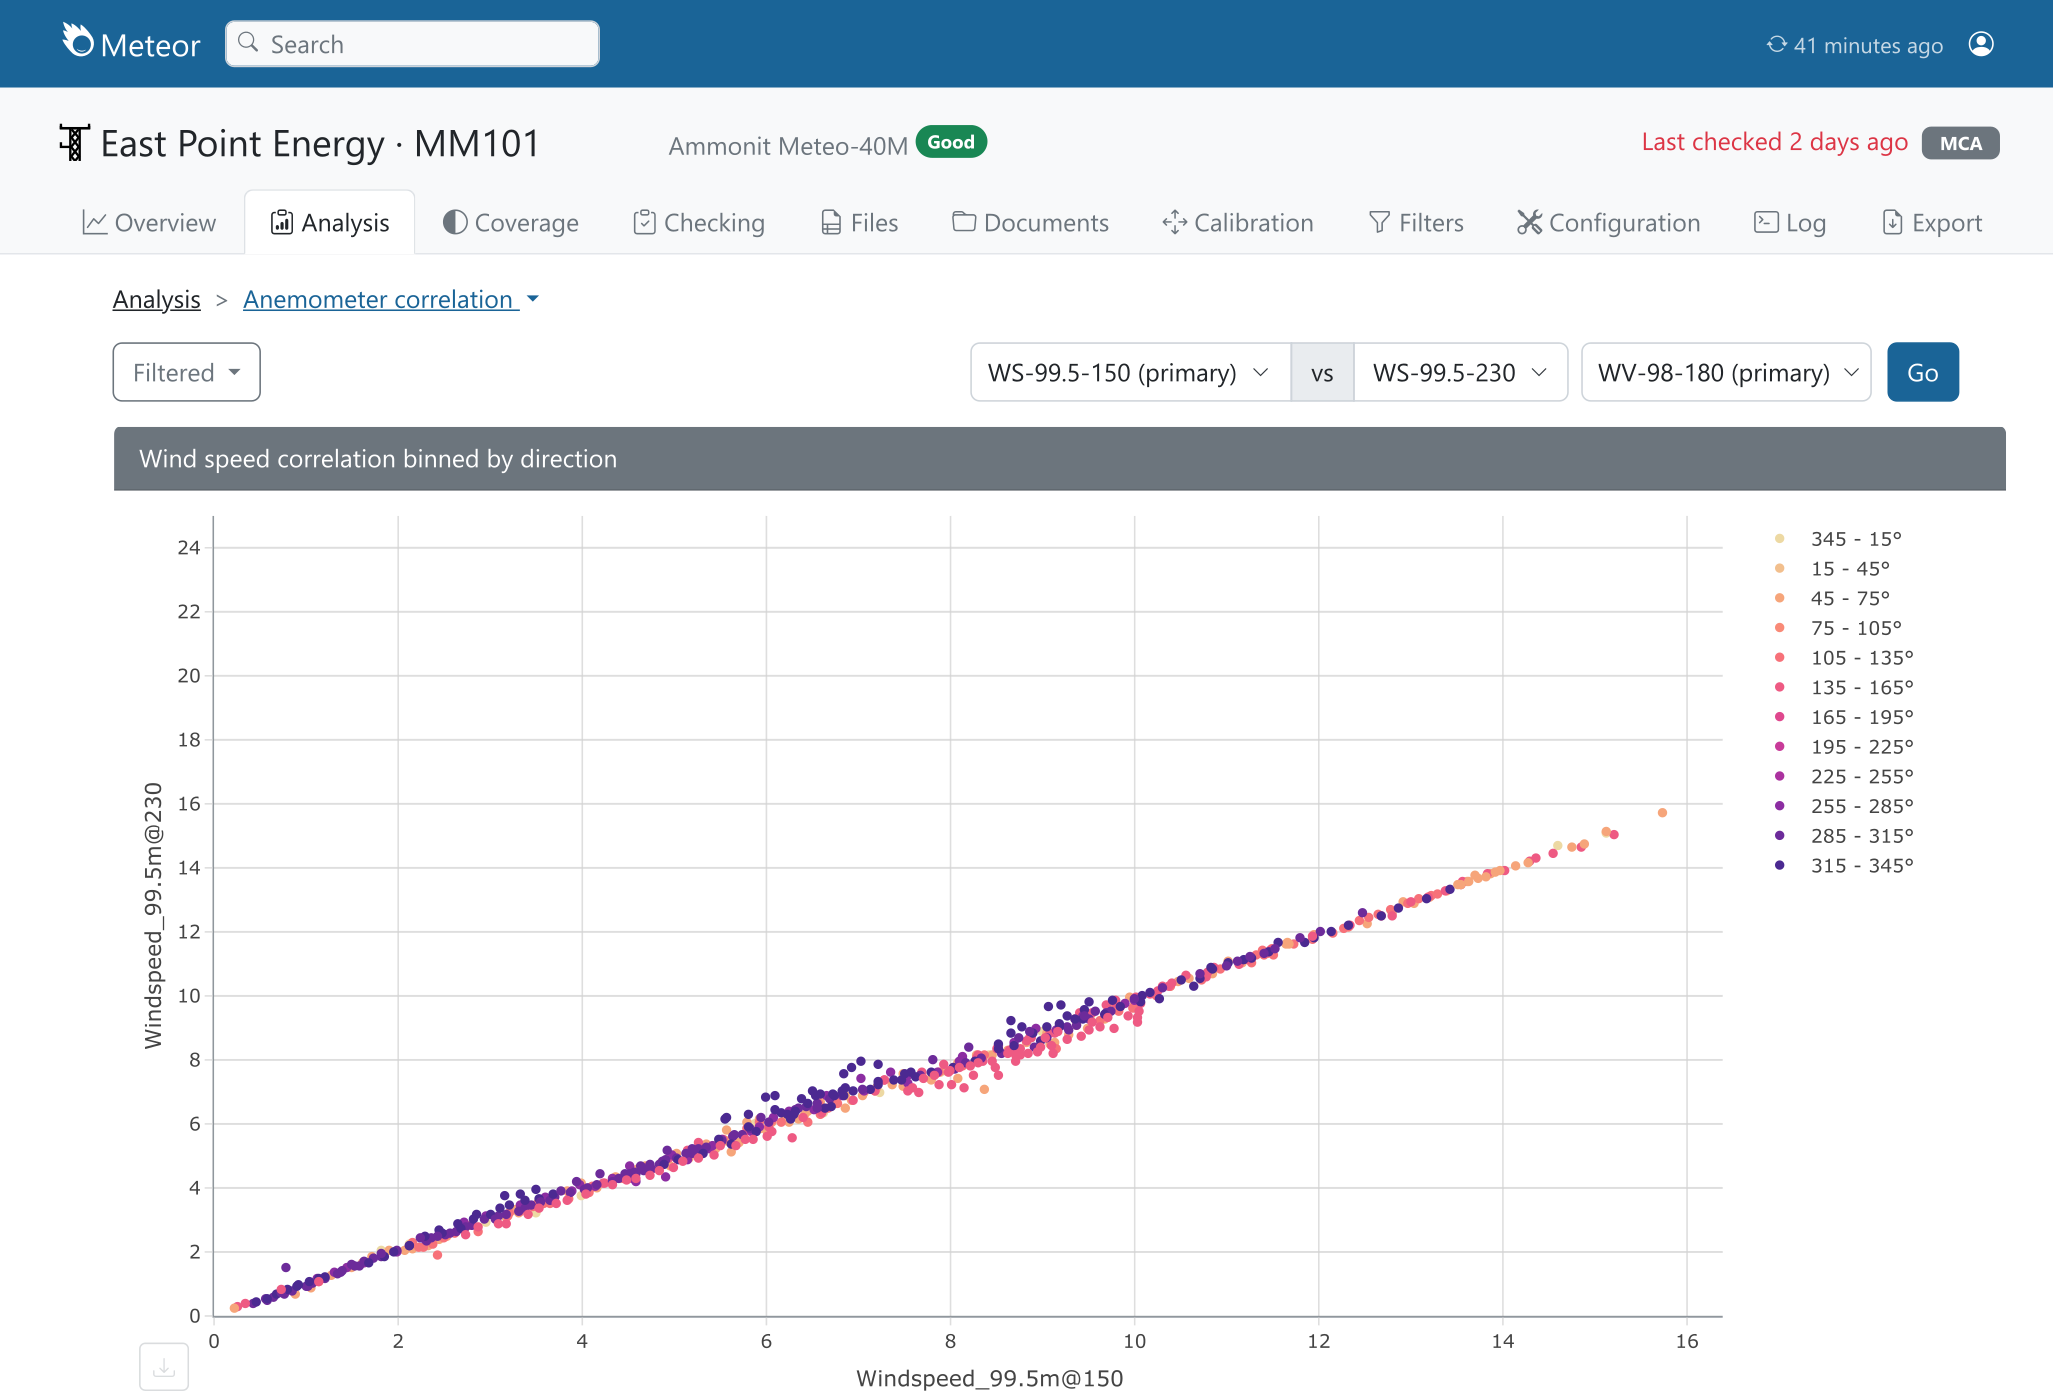
Data visualisation and analytics
A full range of industry standard plots and tables are available for each remote device. These include 12×24 heatmaps, anemometer correlation, data coverage tables, shear plots, turbulence intensity plots, vane correlation plots, wind rose and frequency distribution and wind speed ratio plots.

Configuration management
Meteor takes the pain out of remote device configuration management both when setting up new masts or where configuration changes take place such as instruments replacements or logger upgrades.

Long term forecasting
Data is correlated with global reanalysis datasets to give long-term resource forecasts for use in energy yield assessment analysis.